Debunking the Myth: Los Angeles Wildfires and Rent Gouging Claims Lack Evidence
Debunking the Myth: Los Angeles Wildfires and Rent Gouging Claims Lack Evidence
Written by Ky Trang Ho
Originally published on Medium.
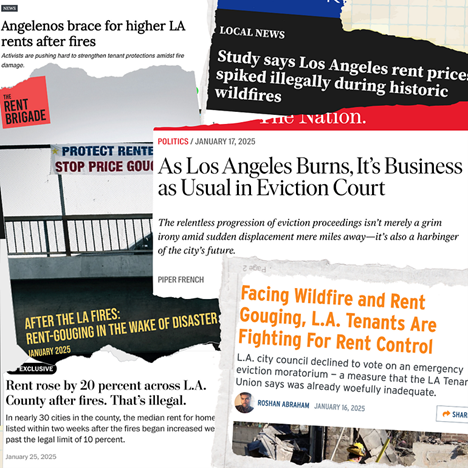
We’ve been inundated with alarming headlines about Los Angeles rents skyrocketing and housing providers price-gouging following the epic wildfires that began on January 7, 2025. However, rental data from Rentcast, a property analytics firm, shows instances of rent gouging are overblown.
I have a myriad of charts in this report to prove, average rents fell or remained flat in wildfire-affected ZIP codes between December 2024 and the end of January 2025. Some properties’ rent has soared by double-digit percentage points over the past three months. However, those spikes occurred before the fires, disproving media reports of price gouging. While there are outsized gains for some types of properties over the past 12 months, averages rents are still deep below their historic highs.
Tenants would be loathe to admit rents are falling in many parts of Los Angeles.
Investigative reports about price gouging from respected outlets like The Washington Post and organizations such as The Rent Brigade — a group that identifies as a “collective of tenant organizers, advocates, web programmers, designers, researchers, and other Angelenos using data to combat predatory landlords” should at best be viewed as anecdotal outliers hand plucked from a massive data pool to support a preconceived bias: housing providers are heartless, greedy pigs. Anecdotes may illustrate a point but should not be used to draw broad conclusions.
Their research is full of methodological flaws: a small sample size taken mostly from Zillow.com, biased handpicked sample selection versus random, a small time period, and the use of listing data rather than actual rent data. The report only compares prices over a short time and cannot account for extenuating circumstances or seasonality.
For example, the owners could have updated the home, included furniture, added an amenity such as a hot tub, and changed from a long-term to a short-term rental. November and December are the slowest rental months because tenants are least likely to move over the holidays and during the school year. Housing providers could have lowered their prices over this period to attract tenants. When the market rebounded in January, they raised their prices. The conclusion that renters are subjected to widespread price gouging is misleading.
The data collected cannot account for whether an owner changed from renting a portion of the home to the entire place. Renters could have negotiated a lower price, and the actual rent paid is not documented in Zillow. Overgeneralizing based on limited data undermines the credibility of the findings.
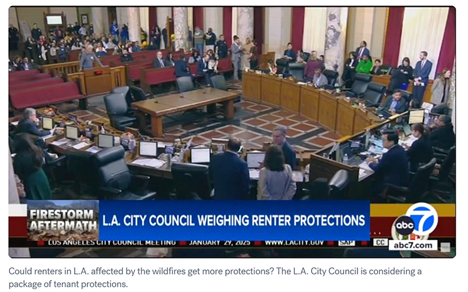
News stories and non-peer-reviewed reports should not be used as the basis for sweeping policy decisions. It is troubling that lawmakers have not researched rent gouging themselves or the number of renters affected by the wildfire. Nor have they hired an independent third party. They’re reckless in proposing draconian, knee-jerk policies like rent freezes and eviction moratoriums across a city of 3.82 million, let alone a county of 9.66 million.
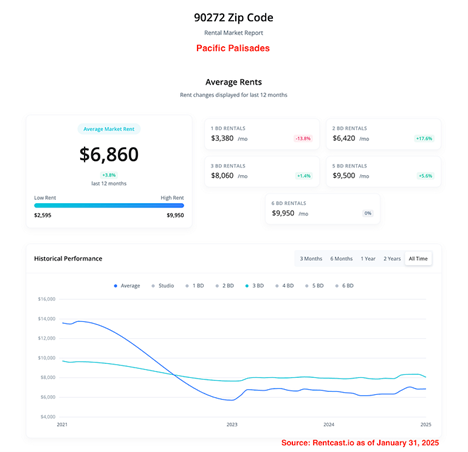
Pacific Palisades, 90272
In the Pacific Palisades zip code most affected by wildfire, 90272, one-bedroom rents on average declined 14% over the past 12 months through January 31, 2025. Three-bedroom rents are nearly flat. Monthly rents for all rental properties, ranging from one to six bedrooms, increased 4% — on par with inflation of 3% over the past year. At $6,860, average rent prices in 90272 would have to double their previous high of nearly $14,000 seen in June 2021.
At first glance, the 18% increase in 2-bedroom rents in the 90272 zip code over the past year could support the accusations. But the hike was long in the making. This category's average rent rose steadily from $5,460 in January 2024 to $6,660 in December 2024. Curiously, two-bedroom rents declined 4% between December 2024 and February 2025, going from $6,660 monthly to $6,420.
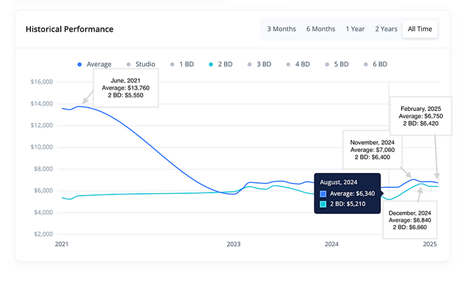
Chart: Rent prices for two-bedrooms and all property types in Pacific Palisades zip code 90272 from 2021 through February 1, 2025. Source: Rentcast.io
The Rent Brigade Report’s Flaws and Inaccuracies
The Rent Brigade report, “After the LA Fires: Rent Gouging in the Wake of Disaster,” claims to have found: “New listings are priced at 315% of Fair Market Rent, nearly double the legal limit” and rents on some units “surged by 5,065% in just 11 days, with 120 new cases identified daily.” The group claims its volunteers collected “1,343 instances of illegal rent increases” using a Google spreadsheet linked on RentBrigade.org that went viral on social media.
The so-called citizen sleuths’ report made headlines at KPCC 89.3 FM, Marketplace, Fox 11 News, KTLA and a handful of small outlets:
- How widespread is post-fire rent gouging? These volunteer sleuths analyzed the data — LAist.org
- Study says Los Angeles rent prices spiked illegally during historic wildfires — KTLA
- LA blazes cause rents to soar — Marketplace
- Rent soaring in these LA ZIP codes after California wildfires, report says — Fox 11 News
The media loves telling stories that pit villains against victims, e.g., landlords versus tenants, because such headlines incite anger, which generates likes and shares in the age of pageview journalism. I don’t mean to insult their reporting. However, they parroted the report and failed to scrutinize how the data was collected or put the numbers in perspective.
The Rent Brigade’s spreadsheet compiled data from three counties: Los Angeles, Orange, and Ventura. Some 90% came from Zillow. As of February 2, there are 17,316 rental listings on Zillow between the three counties. The other 10% of listings came from Apartments.com, Compass, Craigslist, Facebook, The MLS, Redfin, Trulia, and individual housing provider websites. Zillow and Trulia could be considered the same because the same company owns both. Zillow listings are automatically syndicated on Trulia.
The 1,343 handpicked cases account for only 6.7% of listings on mainly one website over a short period, among at least 20 rental listing websites in the area. This small sample should not be considered representative of the population, considering the means of selecting the cases was biased. They are anecdotal cases at best. The study ignores the plethora of units that have lowered prices or offered incentives because they’re hard-pressed to find tenants. Moreover, all of the Rent Brigade data was manually entered by crowd-sourced volunteers, leaving it prone to human error such as misclassification and typos.
Allegations that some listings are “315% of Fair Market Value,” FMV, are wildly unfair because they’re unlikely to make an apples-to-apples comparison.
The U.S. Department of Housing and Urban Development, aka HUD, calculates FMV using data from the American Community Survey (ACS), conducted annually by the U.S. Census Bureau. Data collected from mailed and online surveys, phone calls, and in-person interviews could be outdated by the time the numbers are crunched and presented on HUD’s website.
HUD defines FMR as the 40th percentile of gross rents for typical, non-luxury rental units in a given area. This benchmark for affordability is used to calculate maximum rents for programs like Section 8 housing vouchers.
The zip codes highlighted in the Rent Brigade report are among the most expensive housing markets in the country, with everything from mega-mansions to trailer homes. The age gap between properties could be more than a century.
A unit listed at 315% over FMV could hardly mean it’s overpriced. It could be a new construction condo built in 2024 with a front-desk concierge, Olympic-sized pool, roof-top garden, sauna, etc. It cannot be compared with the “40th percentile of non-luxury units.” Some of these units could be abnormally cheap because of rent control, which applies to multi-family units built before October 1, 1978. Even at that, HUD notes on its website that its calculation for FMV is unreliable.
Why Rentcast is More Accurate
Data from Rentcast, which I use in this report, is more accurate because it compiles more listing and rent data from public databases and numerous property listing sites — not just Zillow — in real-time, and it provides historical context. Rentcast averages listing data over the current month, the past 3 months, 6 months, 1 year and 2 years. It parses data by unit types, e.g., studio, 1 to 5 bedrooms.
Any numbers I present can be fact-checked against the accompanying tables and charts Rentcast produced. You can’t fact-check the Rent Brigade or Washington Post reports because they collected data and crunched their own numbers. You have to trust their methodology, which was highly questionable.
Let’s examine the Rent Brigade’s list of 10 zip codes with the most instances of rent gouging in order of appearance.
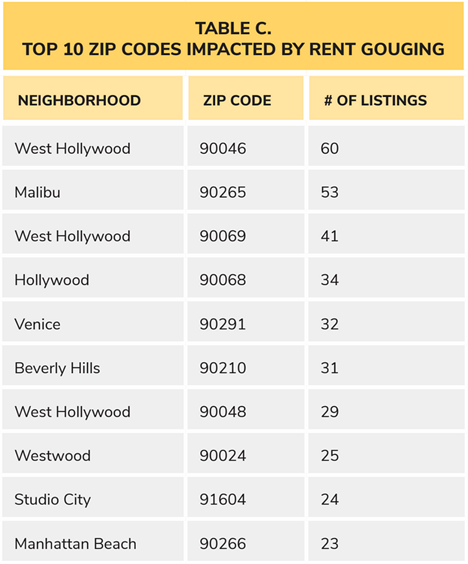
Table: Top 10 zip codes affected by rent gouging. Source: The Rent Brigade.
#1 West Hollywood, 90046
Rents in the West Hollywood zip code 90046 overall ticked up merely 1.1% across all unit types over the past year to an average of $4,540, according to Rentcast. As expensive as that is for most people, it’s a bargain compared to a high of $11,000 from April 2021. How could renters in this zip code be considered to be “impacted by rent gouging” when rent prices overall haven’t even kept up with inflation?
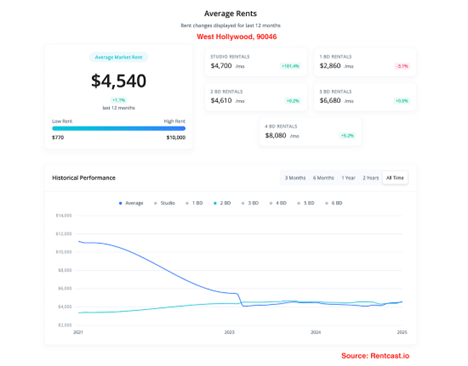
But look studio rents in the 90046 zip code blasted 181% over the past 12 months! That must be price gouging. Nope. Rents have been on the rise over the past two years. Studios experienced hockey-stick shaped price growth between October and December, 2024, spiking from $2,070 to $4,700. Prices stayed at $4,700 a month through January’s end.
If prices were already high in December and stayed the same January, the fires had no affect on the prices for that category.
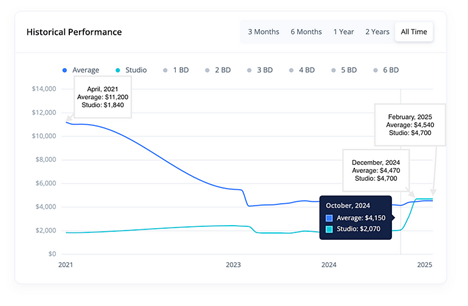
Chart: Prices of studio units in the 90046 zip code from 2021 through Jan 31, 2025. Source: Rentcast.io
#2 Malibu, 90265
Rents in Malibu, 90265, on average ticked up 5% over the past year. The 15% gain seen in four-bedroom units occured between January and December 2024, when they peaked at $9,570. Rents for this category fell 5% between December 2024 and January 2025 from $9,570 to $9,090.
Rents overall in the 90265 zip code have been flat since December and January. If prices were the same or even dropped in one category, how do you explain the fire’s non-existent impact on supply and demand?
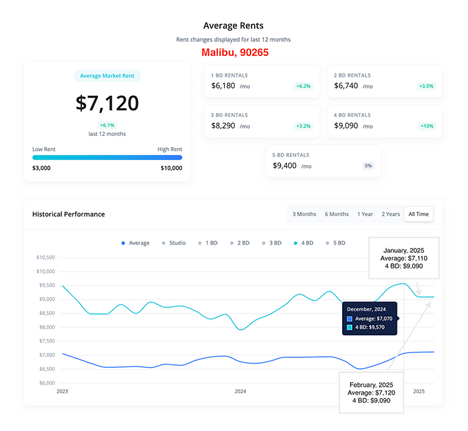
Chart: Average rents from 2023 to 2025 in Malibu, 90265. Source: RentCast.io as of February 2, 2025.
No conclusions of gouging could be made in the other nine zip codes on the Rent Brigade list when you zoom out and look at the entire market and price trends over the past month and 12 months.
#3 West Hollywood, 90069
Average market rent in Hollywood, 90069, declined 4% over the past year, as of January 31, 2025, according to Rentcast. They’re flat over the past three months. Wouldn’t prices have increased if there was gouging in January?
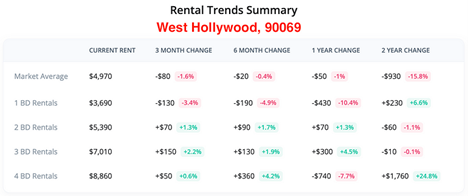
Table: Rental price trends in West Hollywood, 90069, over 3 and 6 months, 1 and 2 years, as of February 2, 2025. Source: Rentcast.
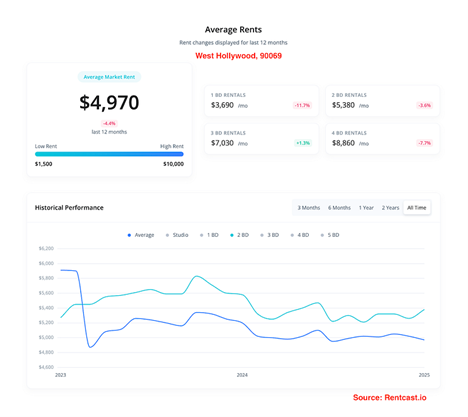
Table: Rental price trends in West Hollywood, 90069, over 3 and 6 months, 1 and 2 years, as of February 2, 2025. Source: Rentcast.
#4 Hollywood, 90068
Eye-popping double-digit rent hikes over the past year are no doubt painful for renters. But the fact that average rents rose 6% at most across all property categories over the past three months rules out the presence of rent gouging.
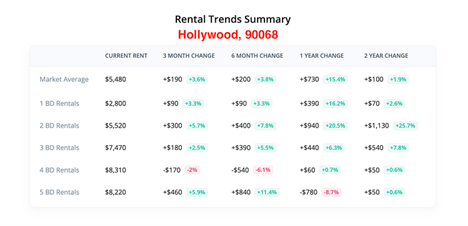
Table: Rental trends for Hollywood, 90068 over 3-months, 6-months, 1-year, 2-years, as of February 2, 2025. Source: Rentcast.
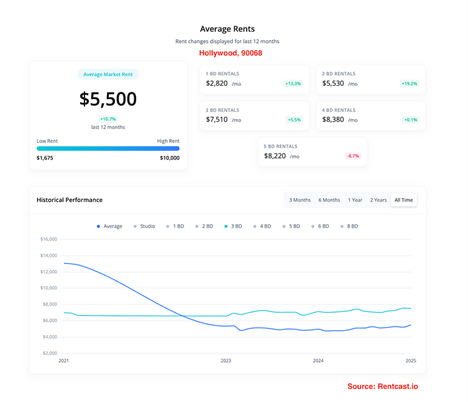
Chart: Average rent prices for 3-bedroom and all units in Hollywood, 90068, from January 2021 to January 2025, as of January 31, 2025. Source: Rentcast.
#5 Venice, 90291
Average market rent in Venice, 90291 zip code, slipped 5% over the past 12 months. Four-bedroom units crashed a whopping 33%. Rents overall were flat the past two months.
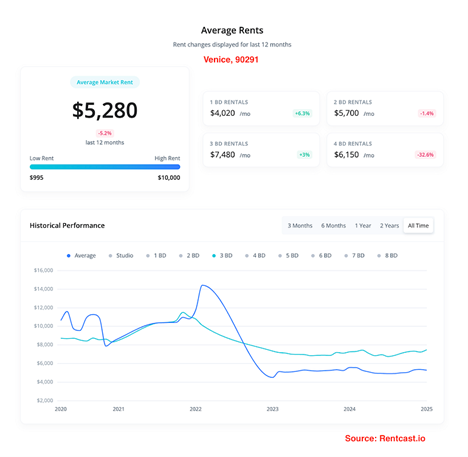
Chart: Average rent prices of 3-bedroom and all units in Venice, 90291, from January 2020 to January 2025, as of January 31, 2025. Source: Rentcast.
#6 Beverly Hills, 90210
Average rents in the country’s most famous zip code, Beverly Hills, 90210, didn’t even keep track with inflation the past 12 months, sinking 3%. Rents are flat looking back three months, disproving there’s an unusual increase in demand or price hikes.
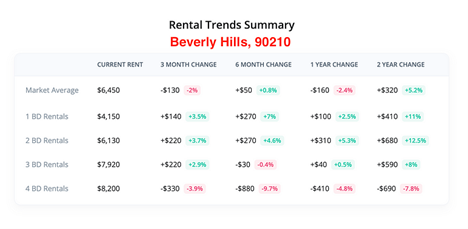
Table: Price changes of average rents for 1-, 2-, 3-, and 4-bedroom units in Beverly Hills, 90210, over 3- and 6-months and 1 year and 2 years, as of February 2, 2025. Source: Rentcast.
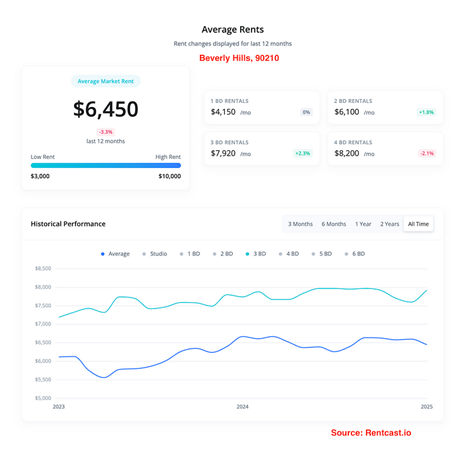
Chart: Rent prices in Beverly Hills, 90210 from January, 2023 to January 2025, as of January 31, 2025.
#7 West Hollywood, 90048
The same could be said for West Hollywood, 90048. Rents for all unit types overall flatlined the past three months.
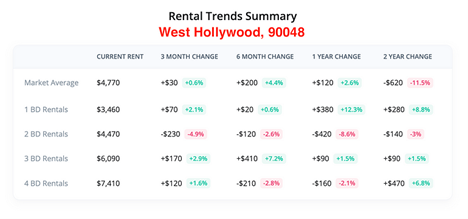
Table: Price change of 1-, 2-, 3-, and 4-bedroom rentals in West Hollywood, 90048, over 3 and 6 months and 1 and 2 years, as of February 2, 2025. Source: Rentcast.
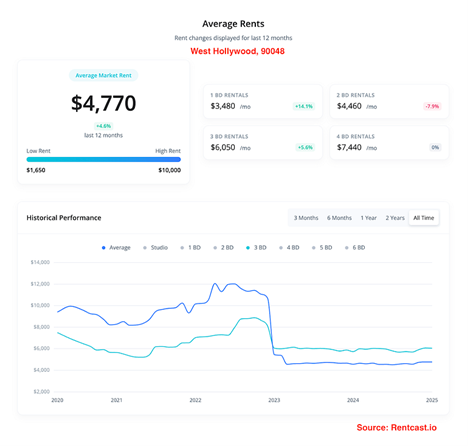
Chart: Average rents for 3-bedroom and all unit types in West Hollywood, 90048, from January 2020 to January 2025, as of January 31, 2025. Source: Rentcast.
#8 Westwood, 90024
Average rents in the Westwood, 90024, home to UCLA, have been downtrending since February 2024. Renters entering the market in January 2025 on average paid 7% less than last year. No rent gouging here.
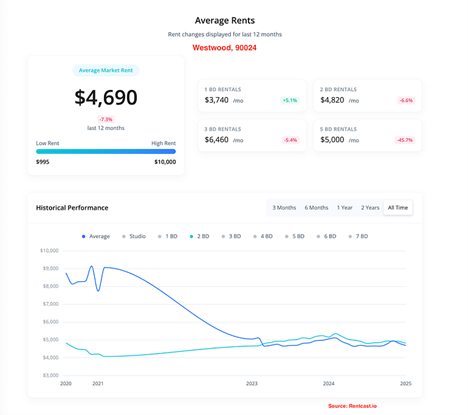
Chart: Average rents for 2-bedroom and all units in Westwood, 90024, from January 2021 to January 2025, as of January 31, 2025. Source: Rentcast.
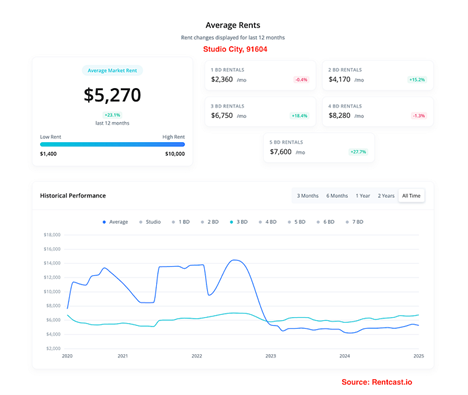
#9 Studio City, 91604
Average rents for four bedroom units in Studio City, 91604, ticked up the most among all categories at 4% over the past three months, as of February 2, 2025. One- and 5-bedroom units are flat over the same period. Where is the supposed increased demand resulting from the fire?
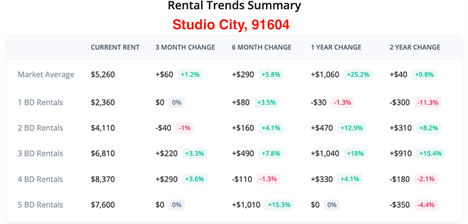
Table: Average rent price changes for 1-, 2-, 3-, 4-, 5–bedroom units and market overall in Studio City, 91604, over 3 and 6 months and 1 and 2 years, as of February 2, 2025.
#10 Manhattan Beach, 90266
One-bedroom rent appreciation at 9% in Manhattan Beach, 90266, over the past three months is huge compared to all the other zip codes and unit types in the Rent Brigade report. However, most of the appreciation occurred before the fire. Average rents for all unit types went sideways between December 2024 and January 2025.
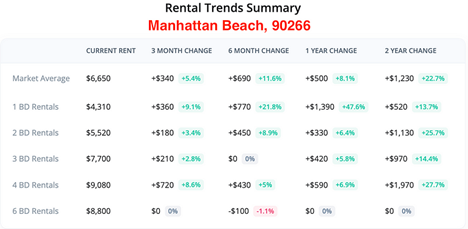
Table: Average rent price changes for 1–6 bedroom units and overall in Manhattan Beach, 90266, over 3 and 6 months and 1 and 2 years, as of February 2, 205. Source: Rentcast.
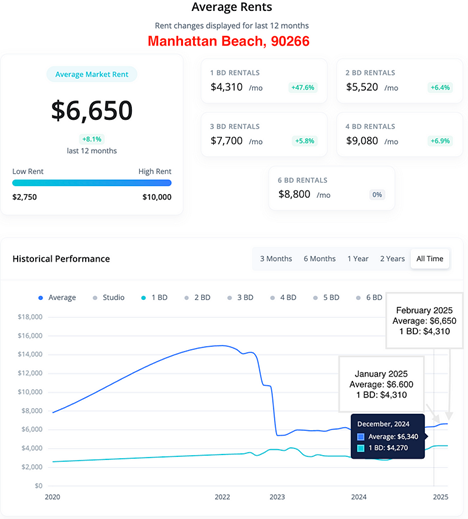
Chart: Average rents for 1-bedroom and all units in Manhattan Beach, 90266, from January 2020 through February 2, 2025. Source: Rentcast.
Washington Post Findings Versus Mine
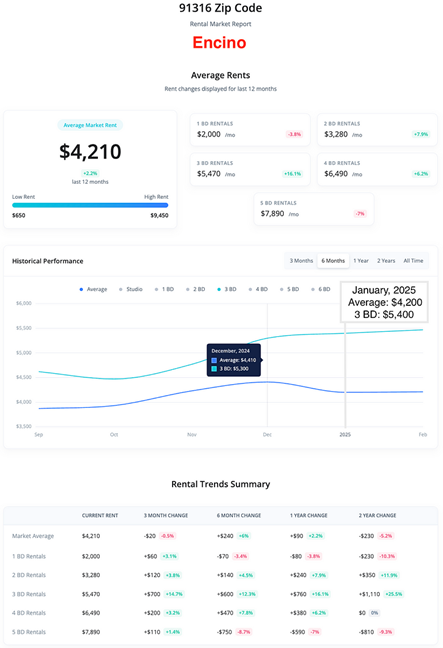
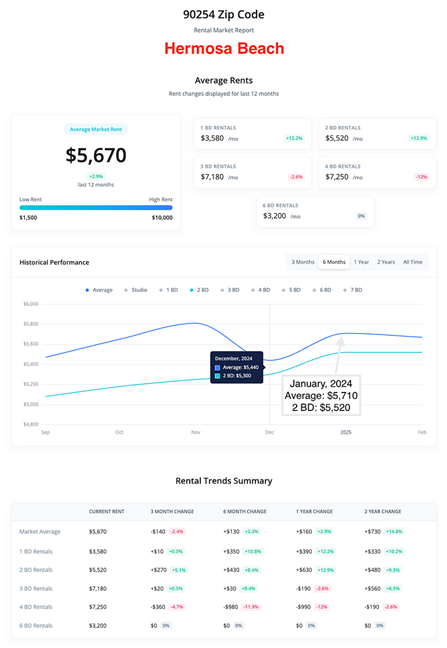
It’s curious that the Washington Post also used Rentcast data to conclude that Los Angeles County rents soared 20% after the fires. Its analysis of rental listings found that rents in Encino vaulted 130% and 100% in Hermosa Beach. I found that rents in these two areas rose on par with inflation over the past year.
The data I pulled from Rentcast shows rents on average in Encino dipped by 0.5% between December 2024 and January 2025. Rents for 3-bedroom units ticked up 2%. Rents overall in Hermosa Beach climbed 5% over the same period. Looking back 12 months, rent in both areas rose on par with inflation.
The differences in my findings could be attributed to my using rents averages over two months and the entire universe of units tracked by Rentcast. The Washington Post collected data from about 1,700 listings in the two weeks before and 3,000 after the fire from across Los Angeles County. It doesn’t explain how it selected its sample size. However, as I explained earlier, the selection method could have been biased and full of errors. An independent third party would have to review their methodology and data analysis to determine whether their conclusions are valid.
If the Washington Post’s conclusion is scientifically valid, the immediate increase it found could be a temporary fluctuation or “noise” in the data known to arise from a sudden shock from a natural disaster.
However, it does not reflect a sustained trend.
Perhaps displaced residents moved to another state or moved in with family. I wouldn’t be surprised if half the Pacific Palisades and Malibu residents sought refuge in a second home somewhere. The median income in the Palisades is $181,000 a year and $97,000 for Malibu versus $51,500 for the rest of the city, according to Statistical Atlas. This could offset the supply shock, preventing rents from rising significantly over the longer term.
The Washington Post article profiled a handful of displaced residents who struggled to find affordable homes. For each of their stories, I could find an equal number of housing providers who have heard crickets from their listings and lowered their prices or offered a free month of rent. I created my spreadsheet to track price declines. I created a form that I hope others will fill out to show that supply-demand balance is not as out of whack as the media portrays it to be.
Why are Price Hikes MIA?
The Eaton and Palisades fires in near and in Los Angeles destroyed over 16,000 homes and other structures in 2025. It’s baffling that least 16,000 households in need of a new home didn’t drive up prices between December and January.
The fact that rents didn’t go up as much as the headlines would lead you to believe that we misjudged supply and demand and overestimated scarcity while underestimating demand.
Perhaps there’s more housing available than expected because Los Angeles and California have been declining for years. Or what if housing providers didn’t jack up prices, and renters didn’t bid up as much as expected?