A Final Look at 2021: A Historic Year

This articles was contributed by Jordan Brooks, Senior Market Analyst, ALN Apartment Data
After a rough 2020, the year 2021 brought its own challenges for the multifamily housing industry. And yet, at the national level, the year also brought record apartment demand and rent growth not seen in at least a generation. Even as portions of California struggled relative to the national averages, the Los Angeles metro area was an example of a market that mirrored the country as a whole quite closely.
All numbers below will refer only to conventional multifamily properties of at least 50 units. Geographically, the Los Angeles – Long Beach – Anaheim metropolitan statistical area (MSA) will be covered.
New Units and Net Absorption
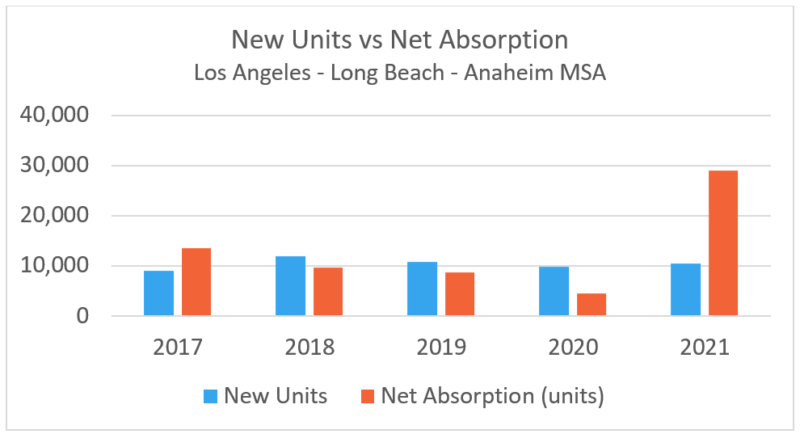
More than 10,000 new units were delivered across the Los Angeles metro area, a small increase from 2020 and right around the annual average established from 2018 through 2020. The delivery activity was most focused in the Mid-Wilshire – Central Los Angeles submarket, an area that saw more than 3,000 new units introduced during the year. Other areas with notable new supply included the Brentwood – Westwood – Olympic Corridor and Woodland Hills – Canoga Park submarkets with each adding approximately 1,000 new units. In all, 60% of the 32 ALN Apartment Data submarkets for the Los Angeles metro area saw some level of new supply in 2021.

Whereas new supply was roughly in line with recent years, apartment demand was decidedly not. Net absorption of about 29,000 units during the year was third-most in the nation behind Dallas – Fort Worth and Houston, and was also more than in 2018, 2019, and 2020 combined for the area. The Greater Downtown submarket, with about 4,100 net absorbed units, and the 3,600 net absorbed units in the Hollywood – Silver Lake area led all submarkets. The Tustin – Irvine region was the only other to manage a net gain of at least 2,500 newly leased units with just over 2,600. Only three submarkets suffered a net loss in rented units for the year, and none lost more than the 200 or so units in the Mid-Cities East area.
The demand picture was quite different from 2020 from a price class perspective as well. Net absorption in 2021 more than tripled that from 2020 in both the Class A and Class B subsets with a net gain of more than 9,000 leased units for each. For Class C and Class D properties, the story was negative demand flipping back into positive territory. Class C properties shed almost 800 net leased units in 2020, and for Class D the retraction was by about 300 net units. In 2021, net absorption was positive by about 4,600 units and 1,200 units for each of those subsets respectively.
Average Effective Rent and Lease Concessions
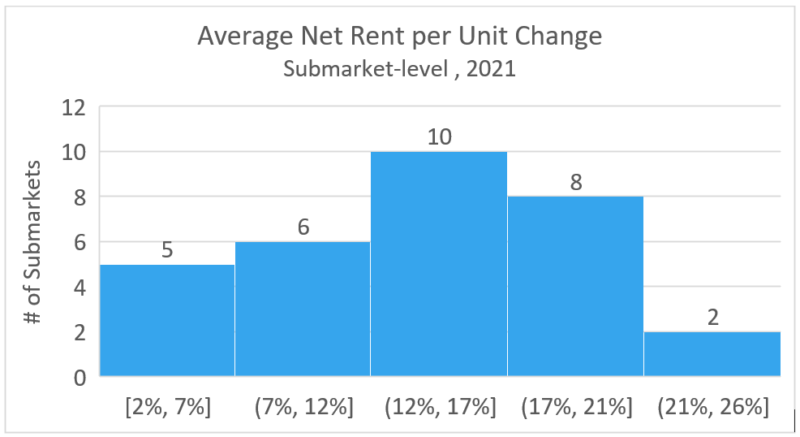
The combination of a typical level of new supply and much higher than normal apartment demand fueled double-digit annual rent growth for the Los Angeles metro area as a whole. Average effective rent growth, measured as the effective rent for a new resident, grew by about 12% in 2021 to close the year at a little less than $2,500 per month. Two submarkets, Mid-Wilshire – Central Los Angeles and Long Beach stood out from the rest with annual appreciation of 24% and 20% respectively. On the other end of the spectrum, three areas saw average effective rent climb by less than 5% during the year: Beach Cities, Mid-Cities West, and San Fernando Valley.

Here too, the picture from a class perspective was starkly different than in 2020. Rent growth was negative in 2020 for the top three price tiers, led by a 5% loss for Class A. In 2021, Class A average effective rent rose by 15% while Class B gained 14% and Class C added 10% at the average. These increases obviously made up for 2020 losses, and then some. For Class D properties, an annual gain of just over 1% in 2020 was followed by an increase of nearly 4% in 2021. One the one hand, the broad-based nature of the growth is a positive indication of strong fundamentals for the market, on the other, affordability concerns will not be alleviated – particularly in the Class C segment.
Of course, the movement in lease concession availability played a major role in rent growth. A 60% annual decline in availability resulted in only 10% of conventional properties across the Los Angeles metro area offering a new lease discount to close the year. This was the lowest rate of availability to end a year since 2018, and almost exactly equal to that from the end of 2017. However, there was not uniformity among the submarkets. While no area logged an increase in lease concession availability, the Greater Downtown and Santa Monica – Marina Del Rey regions remained elevated relative to the rest of the market – with about 30% and 25% of properties offering a discount respectively.
Key Takeaways
2021 will be a year that is referenced and discussed in the multifamily industry for years to come. Record demand fueled a jump in average occupancy, a full retreat of lease concessions, and rent growth unlikely to be matched any time soon. The Los Angeles metro area was certainly not a market left out of those developments. Apartment demand greater than in the three previous years combined fueled double-digit rent growth and prevented any submarket from seeing a further slide in average effective rent for the year.
Whether it is the continued impact of the COVID-19 pandemic, construction difficulties, exacerbated affordability concerns and more, 2022 is sure to bring its own challenges. But many of the factors that fueled the historic performance of 2021 remain in place and although 2022 will almost certainly not post numbers as gaudy, there is little reason to expect anything other than a robust year for the multifamily industry.
Jordan Brooks is a Senior Market Analyst at ALN Apartment Data. In addition to speaking at affiliates around the country, Jordan writes ALN’s monthly newsletter analyzing various aspects of industry performance and contributes monthly to multiple multifamily publications. He earned a master’s degree from the University of Texas at Dallas in Business Analytics. For more information visit the ALN Apartment Data website at www.alndata.com.
